Fund Managers’ Letter
3rd Quarter 2026 — Jacques Berghmans et Félix Berghmans
Foreword
Dear Reader,
Three months ago, I wrote to you that corporate profitability was excellent and that the global economy was more stable than some news headlines suggested. The last three months was more of the same with a booming technology and financial sector significantly boosting corporate profits and sustaining economic growth and employment across the world. Unlike in the first six months though, the global stock market didn’t move much during the summer, as the positives didn’t compensate for the erratic behaviour of the American administration and the increasing tensions in the global bond market.
Major risks, like the fragile state of government finances and the frictions created by the artificial intelligence investment wave, have not gone away and are now having a big impact on the bond market. Renewed tensions between the U.S. and Iran pushed oil back above $100 a barrel in late August and government bond yields have risen almost everywhere at the same time. Japan’s ten-year yield has reached 3% for the first time since 1996, German yields are at their highest level in fifteen years, and the ECB raised its rates again in September.
Rising interest rates change the rules of the game. When money is no longer free, investors pay more attention to what a business actually produces in cash, rather than what it promises to earn in ten years’ time. More than ever, we are focused on free cash flow generated by companies in our investments. A company that funds its own growth, pays its shareholders and does not depend on the goodwill of its bankers is the best protection I know in an uncertain world.
Jacques Berghmans


Q3 Market and macro-economic Performance
EQUITIES
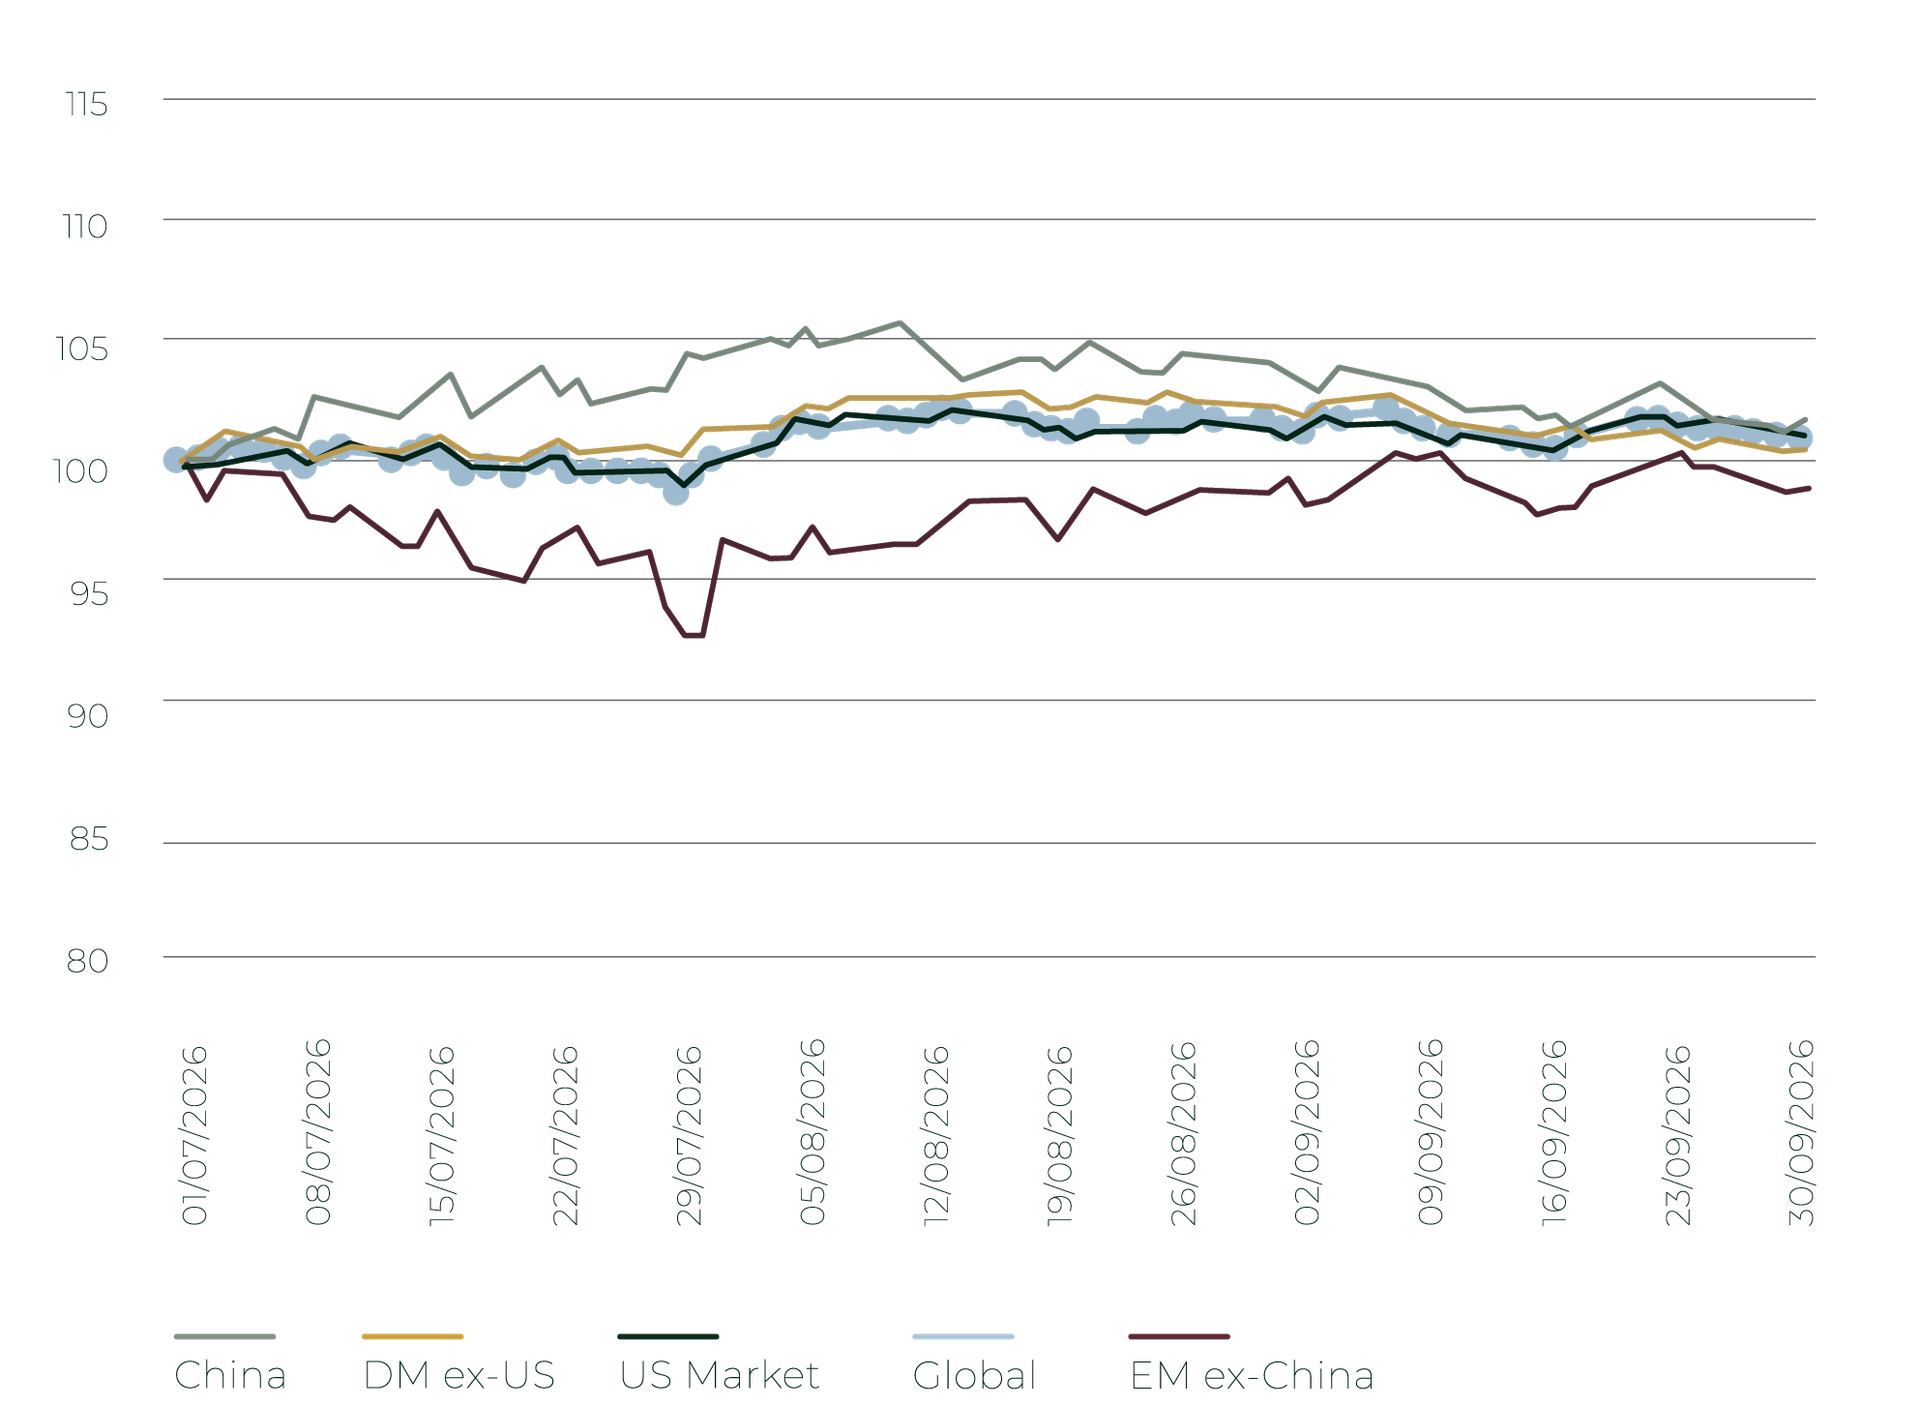
As we have often seen in recent years, the performance and volatility of the global stock market was much less dramatic than the news-cycle might have implied. Despite the geo-political tensions in the Middle East and Europe, the swings in oil prices, and the global rise in interest rates, the global stock market finished slightly up over the last three months, and most regions finished the quarter in positive territory or flat.
As illustrated on the graph below, there was a reversal in geographic performance in the third quarter compared to the first six months of the year. The MSCI China was the best performing market in the third quarter after a very poor first half of the year. Emerging markets excluding China on the other hand, which had an excellent start in 2026, performed poorly and were down over 15% in less than a month in July - hammered by the poor performance of South Korean memory stocks. The performance of other regions was more pedestrian and mostly flat over the quarter.
Global stock markets performance over the quarter
SOURCE : BLOOMBERG, TREETOP, MSCI
When investing in the stock market, we recommend that clients always look beyond three months performance, but there are still lessons to be learnt from the quarter:
◦ Be cautious with over-hyped sectors or regions: South Korea was the best performing major stock market at the beginning of the year and ended up crashing the hardest in July. A novice investor might look at past performance and find it exciting but disclaimers like past performance is no guarantee of future returns are there for a reason.
◦ Never completely dismiss a region or sector: while bad companies eventually go bust, it is rarer for a sector and even more for a whole country to generate bad performance forever. South Korean stocks once dismissed as permanent laggards as recently as three years ago generated incredible returns before the small bust in July. Closer to us, European banks, which had a lost decade following the financial crisis in 2009, have generated very strong returns in recent years.
When investing, we try to avoid some of these common pitfalls. We take a global approach, as it reduces volatility, and in a globalised world, investment opportunities can be found anywhere. We avoid thematic investment strategies focused on specific sectors. Artificial intelligence, robotics, genetics are all very exciting but concentrated bets without strict valuation criteria are excessively risky especially after a long boom.
MACRO-ECONOMIC SITUATION
DATA AS 23 SEPTEMBER 2026
The main change this quarter was the return of inflation, mainly as a result of the war in the Middle East and to a lesser extend the boom in artificial intelligence investments. In the eurozone, inflation rose to 3.2% in August, with energy prices up more than 14% over one year. Inflation in the United States reached 3.4% and even deflationary economies like China and Japan faced price increases in August.
Q3 Market and macro-economic Performance
EQUITIES
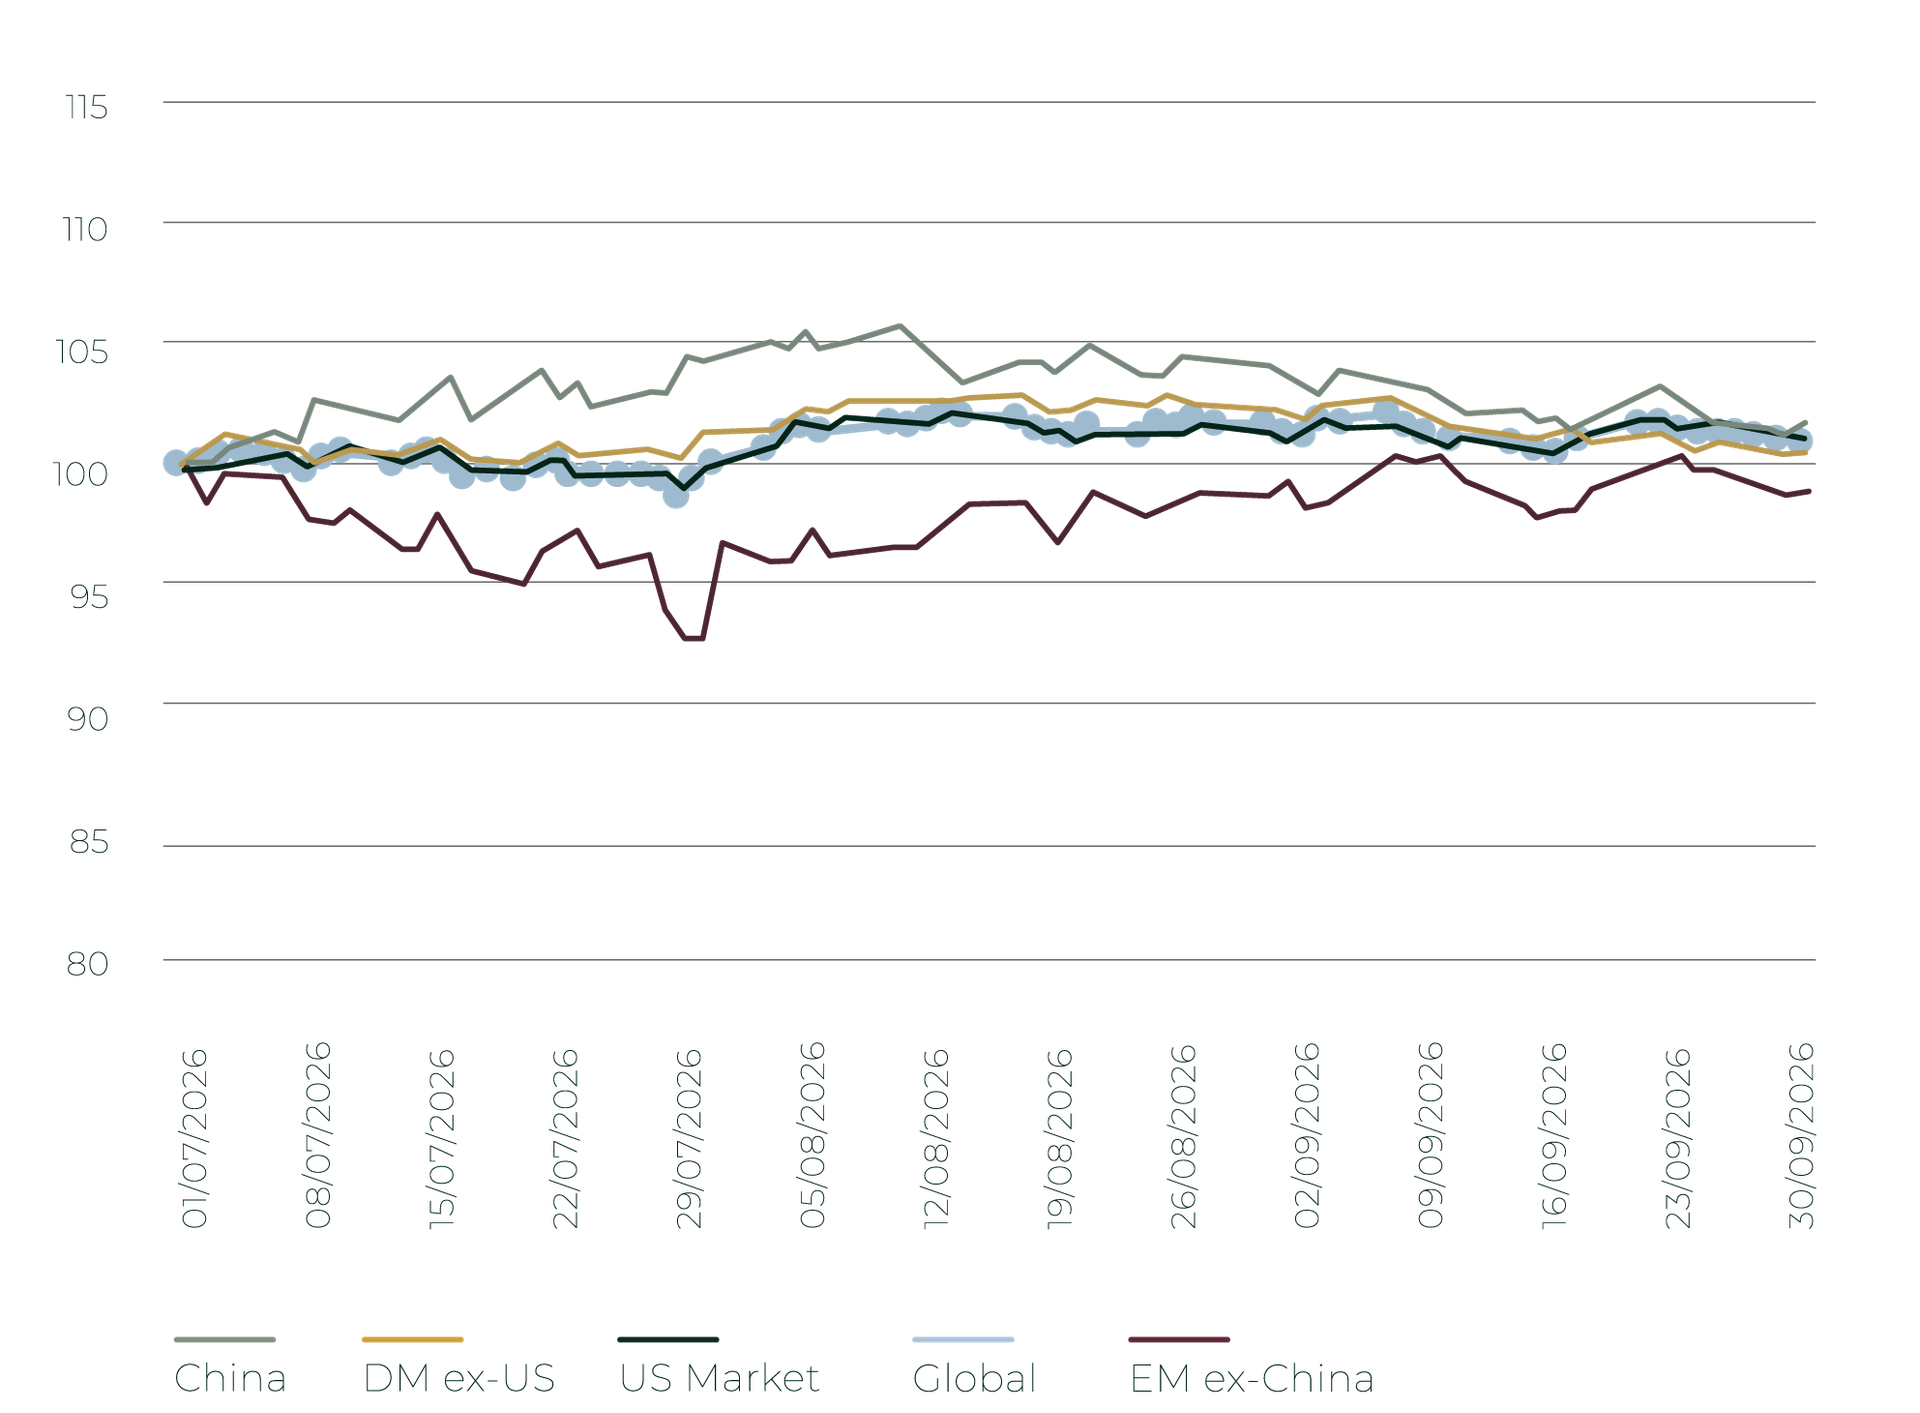
As we have often seen in recent years, the performance and volatility of the global stock market was much less dramatic than the news-cycle might have implied. Despite the geo-political tensions in the Middle East and Europe, the swings in oil prices, and the global rise in interest rates, the global stock market finished slightly up over the last three months, and most regions finished the quarter in positive territory or flat.
As illustrated on the graph below, there was a reversal in geographic performance in the third quarter compared to the first six months of the year. The MSCI China was the best performing market in the third quarter after a very poor first half of the year. Emerging markets excluding China on the other hand, which had an excellent start in 2026, performed poorly and were down over 15% in less than a month in July - hammered by the poor performance of South Korean memory stocks. The performance of other regions was more pedestrian and mostly flat over the quarter.
Global stock markets performance over the quarter
SOURCE : BLOOMBERG, TREETOP, MSCI
When investing in the stock market, we recommend that clients always look beyond three months performance, but there are still lessons to be learnt from the quarter:
◦ Be cautious with over-hyped sectors or regions: South Korea was the best performing major stock market at the beginning of the year and ended up crashing the hardest in July. A novice investor might look at past performance and find it exciting but disclaimers like past performance is no guarantee of future returns are there for a reason.
◦ Never completely dismiss a region or sector: while bad companies eventually go bust, it is rarer for a sector and even more for a whole country to generate bad performance forever. South Korean stocks once dismissed as permanent laggards as recently as three years ago generated incredible returns before the small bust in July. Closer to us, European banks, which had a lost decade following the financial crisis in 2009, have generated very strong returns in recent years.
When investing, we try to avoid some of these common pitfalls. We take a global approach, as it reduces volatility, and in a globalised world, investment opportunities can be found anywhere. We avoid thematic investment strategies focused on specific sectors. Artificial intelligence, robotics, genetics are all very exciting but concentrated bets without strict valuation criteria are excessively risky especially after a long boom.
MACRO-ECONOMIC SITUATION
DATA AS 23 SEPTEMBER 2026
The main change this quarter was the return of inflation, mainly as a result of the war in the Middle East and to a lesser extend the boom in artificial intelligence investments. In the eurozone, inflation rose to 3.2% in August, with energy prices up more than 14% over one year. Inflation in the United States reached 3.4% and even deflationary economies like China and Japan faced price increases in August.
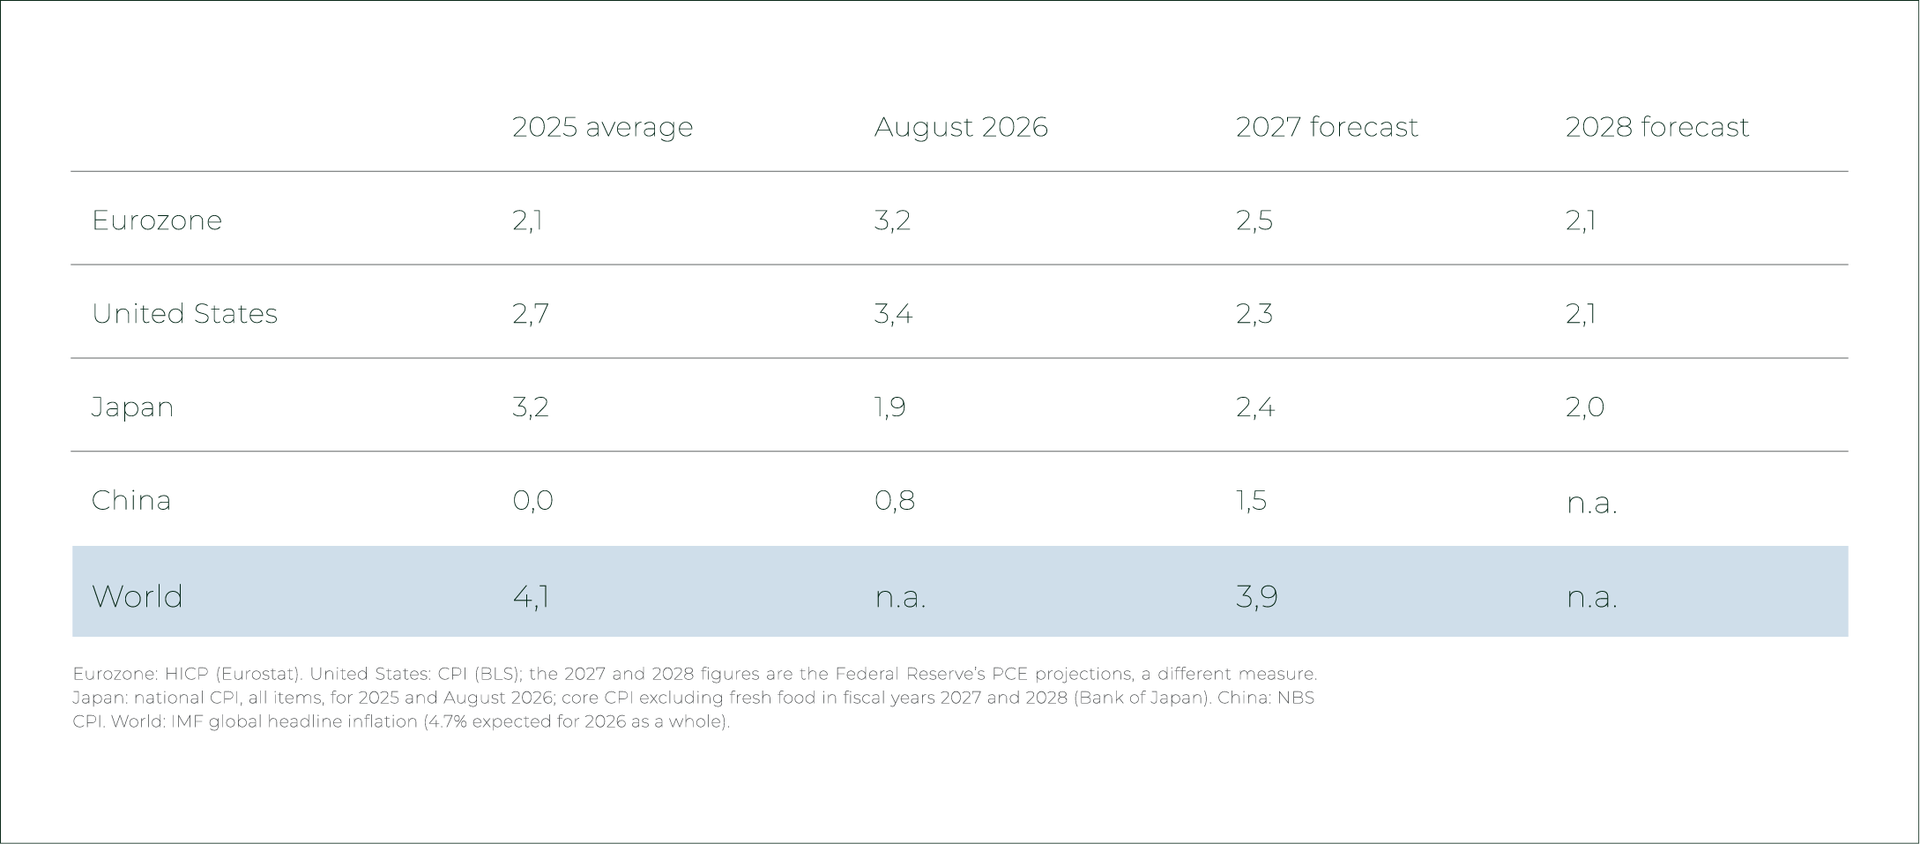
As a result of higher inflation, most central banks increased their interest rates.
In the United States, the Federal Reserve (“Fed”) voted for a hike in its September
meeting despite pressure from the Trump administration to lower them.
The European Central Bank (ECB) raised its deposit rate to 2.50% on 10 September,
and the Bank of Japan raised rates to 1.25%, a 31-year high.
Economic growth, on the other hand, has been more resilient than feared. The US economy
is expanding at a solid pace, supported by consumer spending and investment in artificial
intelligence, with unemployment stable at around 4.2%. The eurozone grew 0.4% in the second
quarter, double what economists expected.
For investors in the global stock market, economic growth is positive as it allows businesses to
find more opportunities to grow and ultimately generate higher earnings which can distributed
to shareholders. Inflation on the other hand is the enemy of the saver, and most households
and businesses suffer from rapidly increasing prices. Higher interest rates is the necessary
evil to fight inflation but reduces asset valuation multiples and can put a lot of pressure on
government, household or business finances if they hold too much debt.

The end of free money: Rising Rates Around the World
« Interest rates are to asset prices what gravity is to the apple. »
Warren Buffett
« Interest rates are to asset prices what gravity is to the apple. »
Warren Buffett
A SYNCHRONISED GLOBAL MOVE
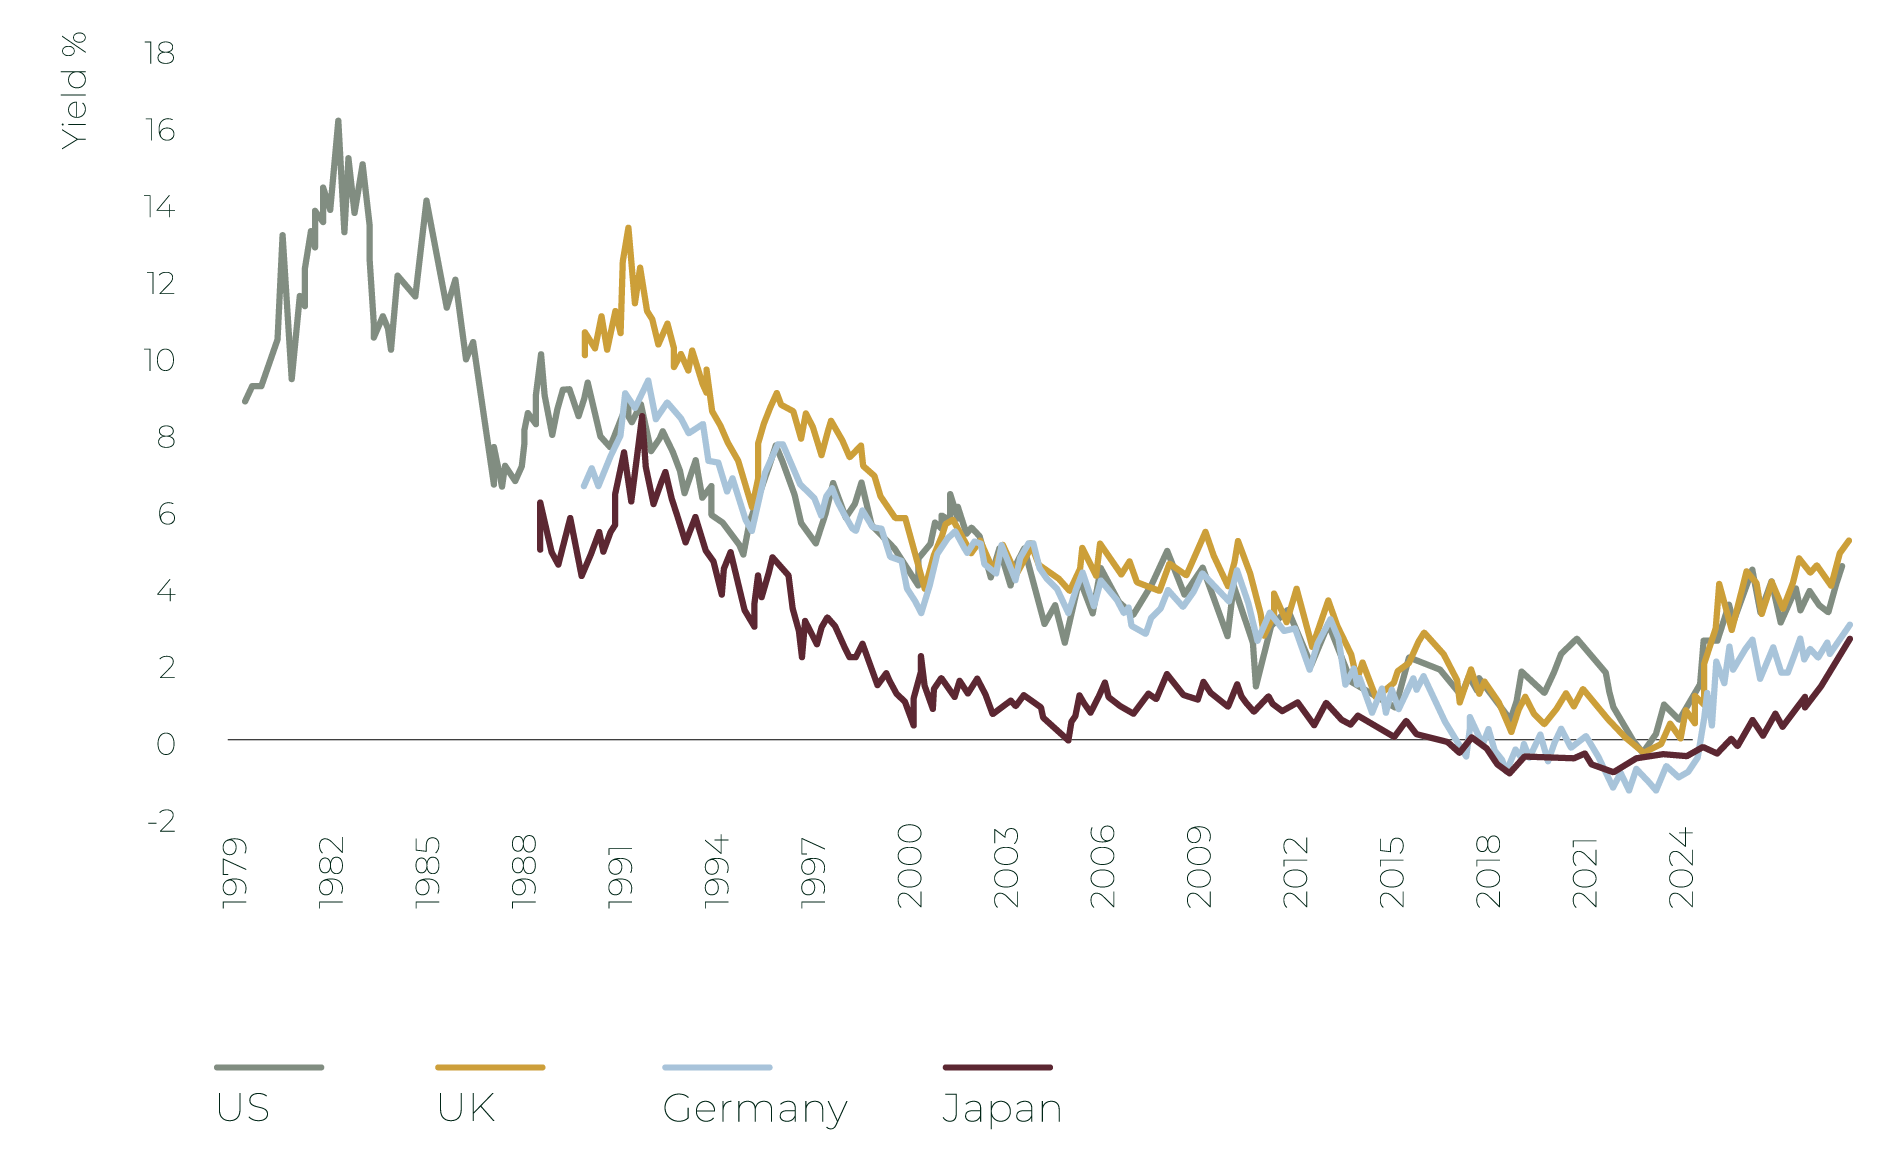
For more than a decade after the financial crisis in 2009, investors lived in a world of near-zero, and sometimes negative interest rates. Before that, most investors have only experienced a world of falling rates as showed on the graph below. That world is now clearly behind us. Recent inflation overshoots in the Western World make us believe that higher rates are likely to be here for longer.
10 Year Government Bond Yields
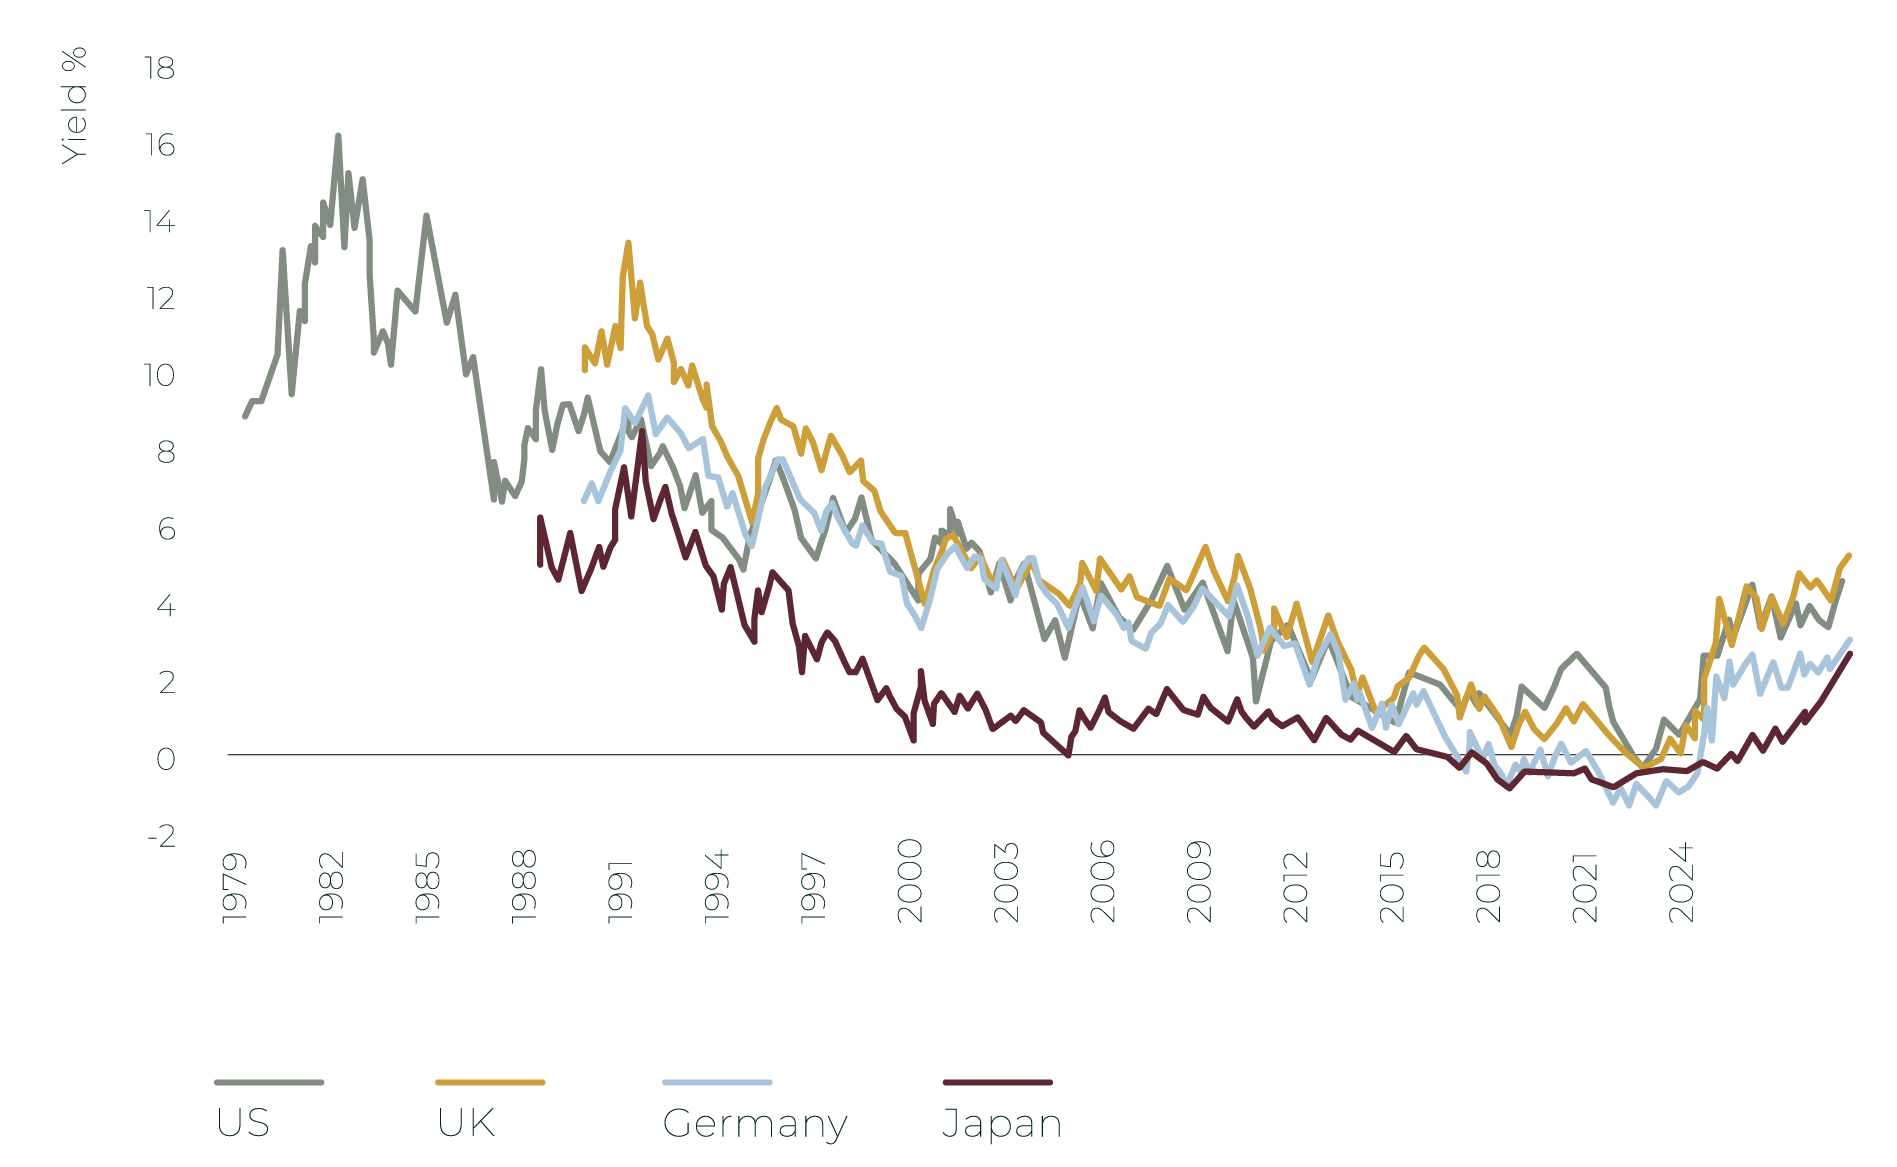
Given the implications of structurally higher yields on asset value, we believe that the next ten years will be different from the last few decades. Simply buying assets to build a nest egg is unlikely to work and some investment strategies with excellent long-term track-records could generate poor returns. At the same time, not investing in this higher inflation environment will result in much lower purchasing power down the road.
WHY YIELDS ARE RISING AND
THE IMPACT ON THE VARIOUS ASSET CLASSES
Several forces are at work, and we think that most of them are unlikely to disappear quickly.
The return of inflation and the increasing need for capital from highly levered governments and
artificial intelligence companies are all pushing yields higher.
Interest rates are the price of money, and every asset is ultimately valued against them.
Intuitively, investors will demand higher returns to invest if they can get close to 4% in a very low
risk bank deposit. This intuitive behaviour can easily be verified mathematically. 100 euros in a
zero-rate environment (first line) is worth the same in 1, 5 or 10 years. At the other extreme, under
a 7% rate environment, the same amount in ten years is only worth 51 euros today.
This simple mathematical truth can have a dramatic impact on various asset classes like:
A SYNCHRONISED GLOBAL MOVE
For more than a decade after the financial crisis in 2009, investors lived in a world of near-zero, and sometimes negative interest rates. Before that, most investors have only experienced a world of falling rates as showed on the graph below. That world is now clearly behind us. Recent inflation overshoots in the Western World make us believe that higher rates are likely to be here for longer.
10 Year Government Bond Yields
SOURCE : BLOOMBERG, TREETOP
Given the implications of structurally higher yields on asset value, we believe that the next ten years will be different from the last few decades. Simply buying assets to build a nest egg is unlikely to work and some investment strategies with excellent long-term track-records could generate poor returns. At the same time, not investing in this higher inflation environment will result in much lower purchasing power down the road.
WHY YIELDS ARE RISING AND
THE IMPACT ON THE VARIOUS ASSET CLASSES
Several forces are at work, and we think that most of them are unlikely to disappear quickly.
The return of inflation and the increasing need for capital from highly levered governments and
artificial intelligence companies are all pushing yields higher.
Interest rates are the price of money, and every asset is ultimately valued against them.
Intuitively, investors will demand higher returns to invest if they can get close to 4% in a very low
risk bank deposit. This intuitive behaviour can easily be verified mathematically. 100 euros in a
zero-rate environment (first line) is worth the same in 1, 5 or 10 years. At the other extreme, under
a 7% rate environment, the same amount in ten years is only worth 51 euros today.
This simple mathematical truth can have a dramatic impact on various asset classes like:
◦ Fixed income: a lot of fixed income instruments have a fixed payout ratio which does not vary over
time. A bond or a credit paying 2% per annum for 10 years becomes much less attractive in a world
where you can have a 3% or 4% yield per year with little risk than in a world where there is no yield.
As we can see on the graph below, global investment grade fixed income has significantly
underperformed the global stock market over the last five years.
◦ Equities. Rising rates hurt the companies whose value lies far in the future most,
because distant profits are discounted more heavily. We have built a case study for
two companies to illustrate this point.
Performance of Global Stocks and Investment grade fixed income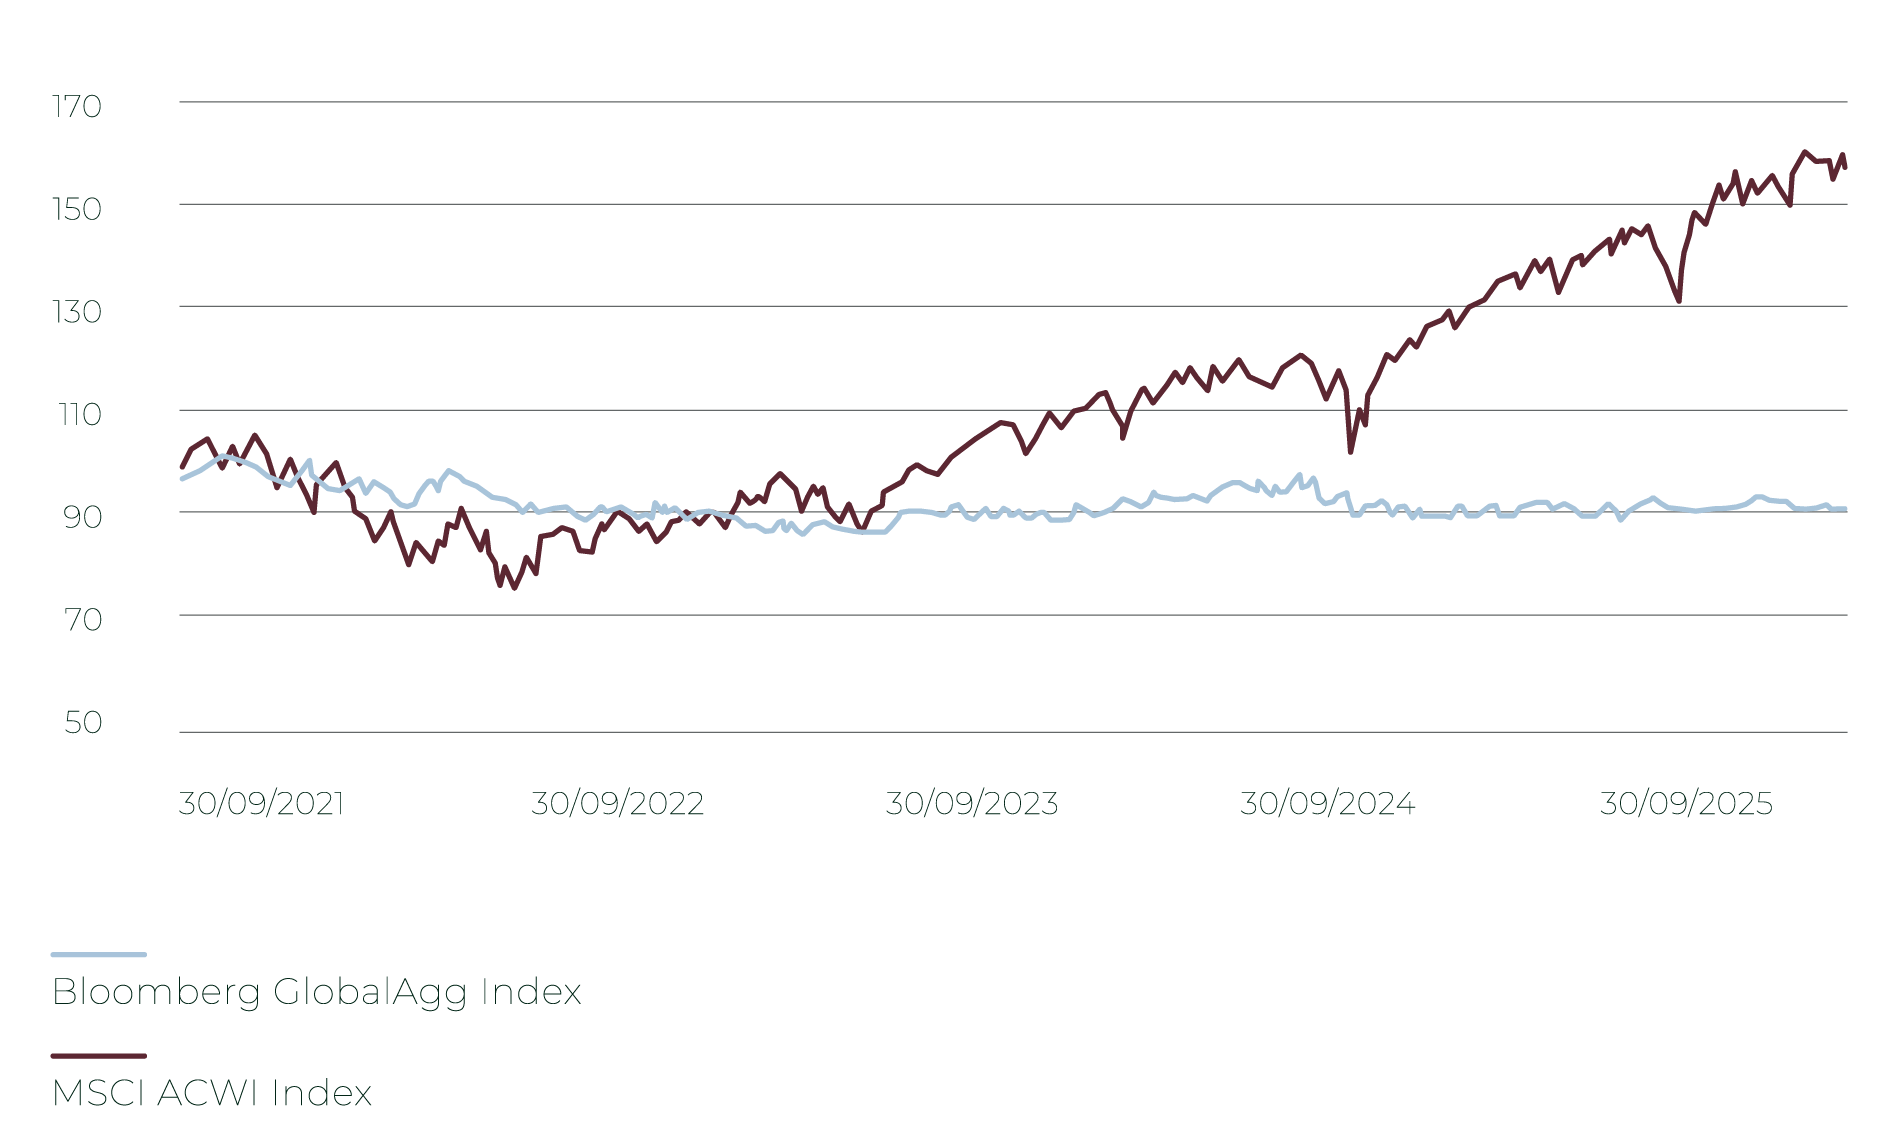
SOURCE : BLOOMBERG, TREETOP
GROW is building something ambitious: it spends heavily for five years, so its free cash flow is
deeply negative, turns positive in year six and settles at €165 million a year. CASHCOW is dull
by comparison, earning a steady €100 million a year with no growth and no surprises. We value
both the way any analyst would: ten years of cash flow, plus a terminal value that assumes each
business continues at its year-ten level indefinitely.
◦ Fixed income: a lot of fixed income instruments have a fixed payout ratio which does not vary over time. A bond or a credit paying 2% per annum for 10 years becomes much less attractive in a world where you can have a 3% or 4% yield per year with little risk than in a world where there is no yield. As we can see on the graph below, global investment grade fixed income has significantly underperformed the global stock market over the last five years.
◦ Equities. Rising rates hurt the companies whose value lies far in the future most, because distant profits are discounted more heavily. We have built a case study for two companies to illustrate this point.
SOURCE : BLOOMBERG, TREETOP
◦ Fixed income: a lot of fixed income instruments have a fixed payout ratio which does not vary over
time. A bond or a credit paying 2% per annum for 10 years becomes much less attractive in a world
where you can have a 3% or 4% yield per year with little risk than in a world where there is no yield.
As we can see on the graph below, global investment grade fixed income has significantly
underperformed the global stock market over the last five years.
◦ Equities. Rising rates hurt the companies whose value lies far in the future most,
because distant profits are discounted more heavily. We have built a case study for
two companies to illustrate this point.
Performance of Global Stocks and Investment grade fixed income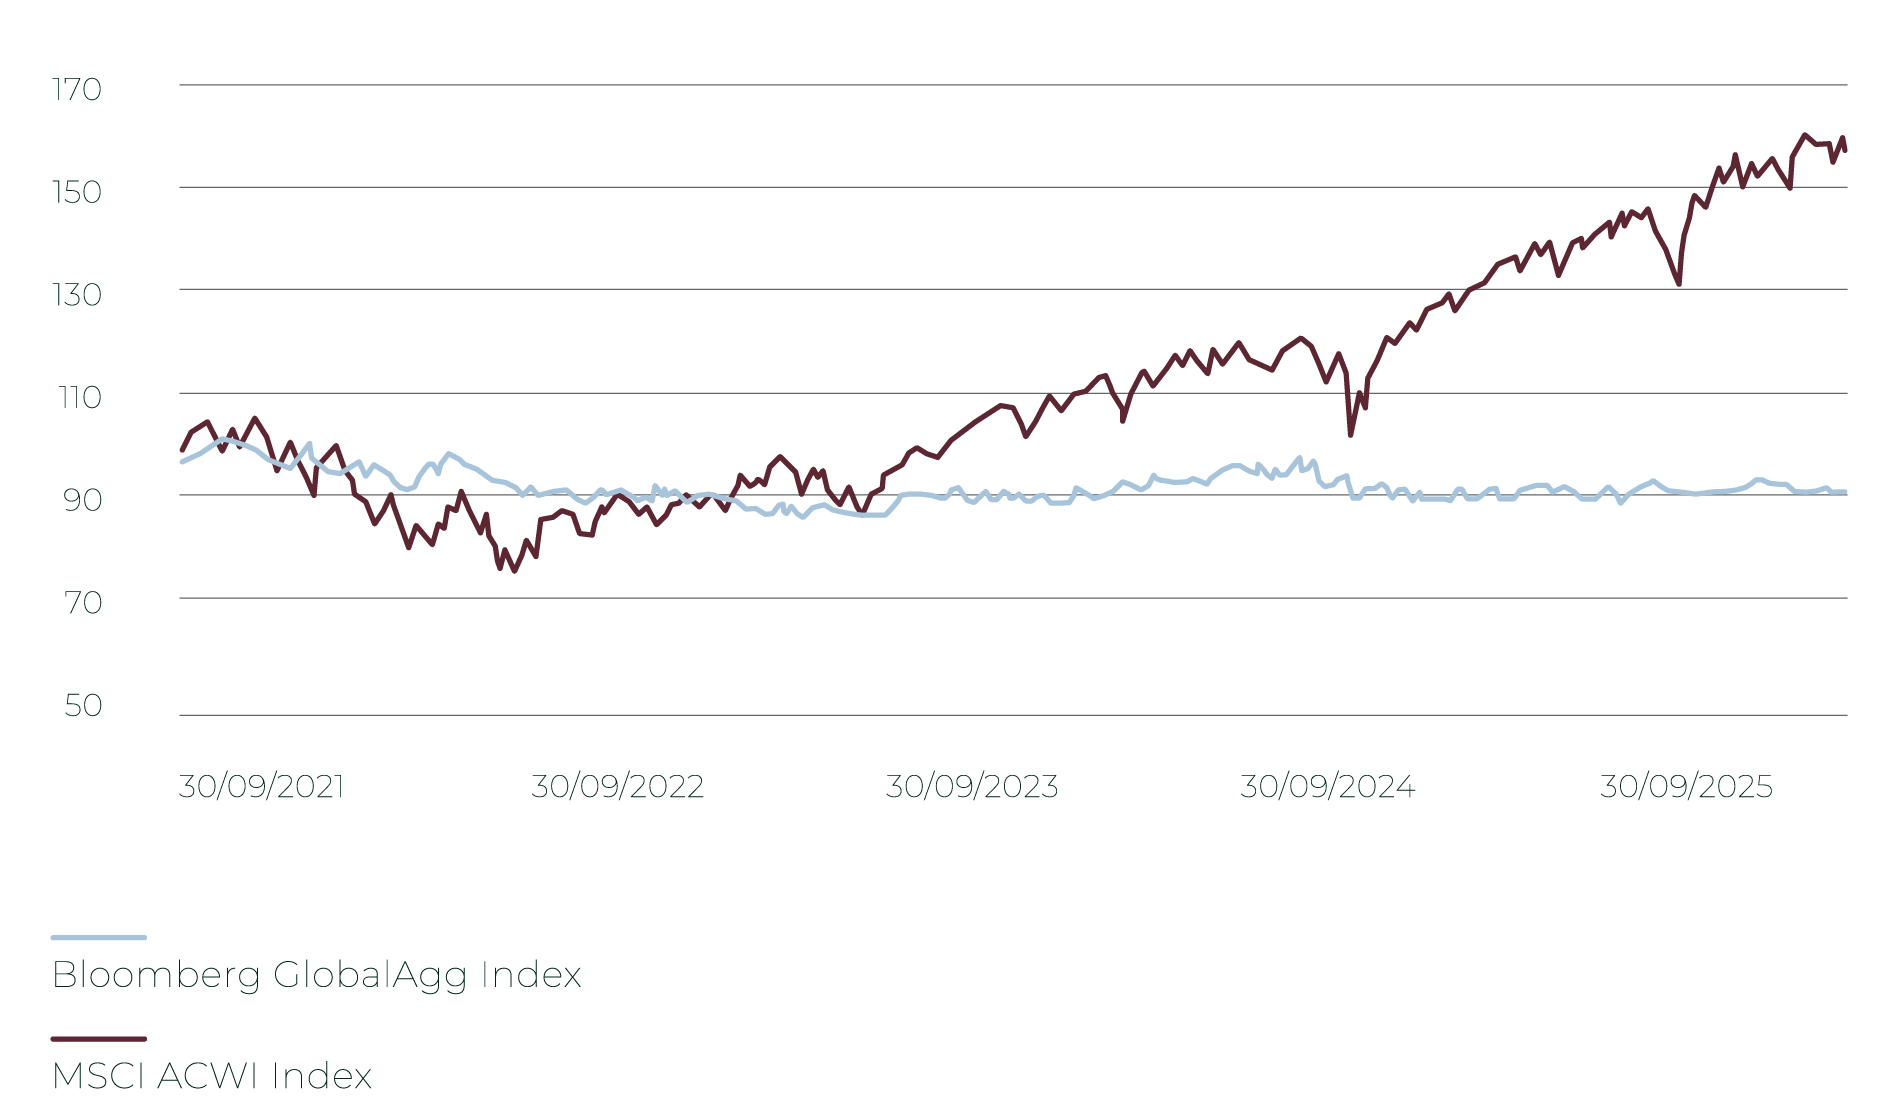
SOURCE : BLOOMBERG, TREETOP
◦ Fixed income: a lot of fixed income instruments have a fixed payout ratio which does not vary over time. A bond or a credit paying 2% per annum for 10 years becomes much less attractive in a world where you can have a 3% or 4% yield per year with little risk than in a world where there is no yield. As we can see on the graph below, global investment grade fixed income has significantly underperformed the global stock market over the last five years.
◦ Equities. Rising rates hurt the companies whose value lies far in the future most, because distant profits are discounted more heavily. We have built a case study for two companies to illustrate this point.
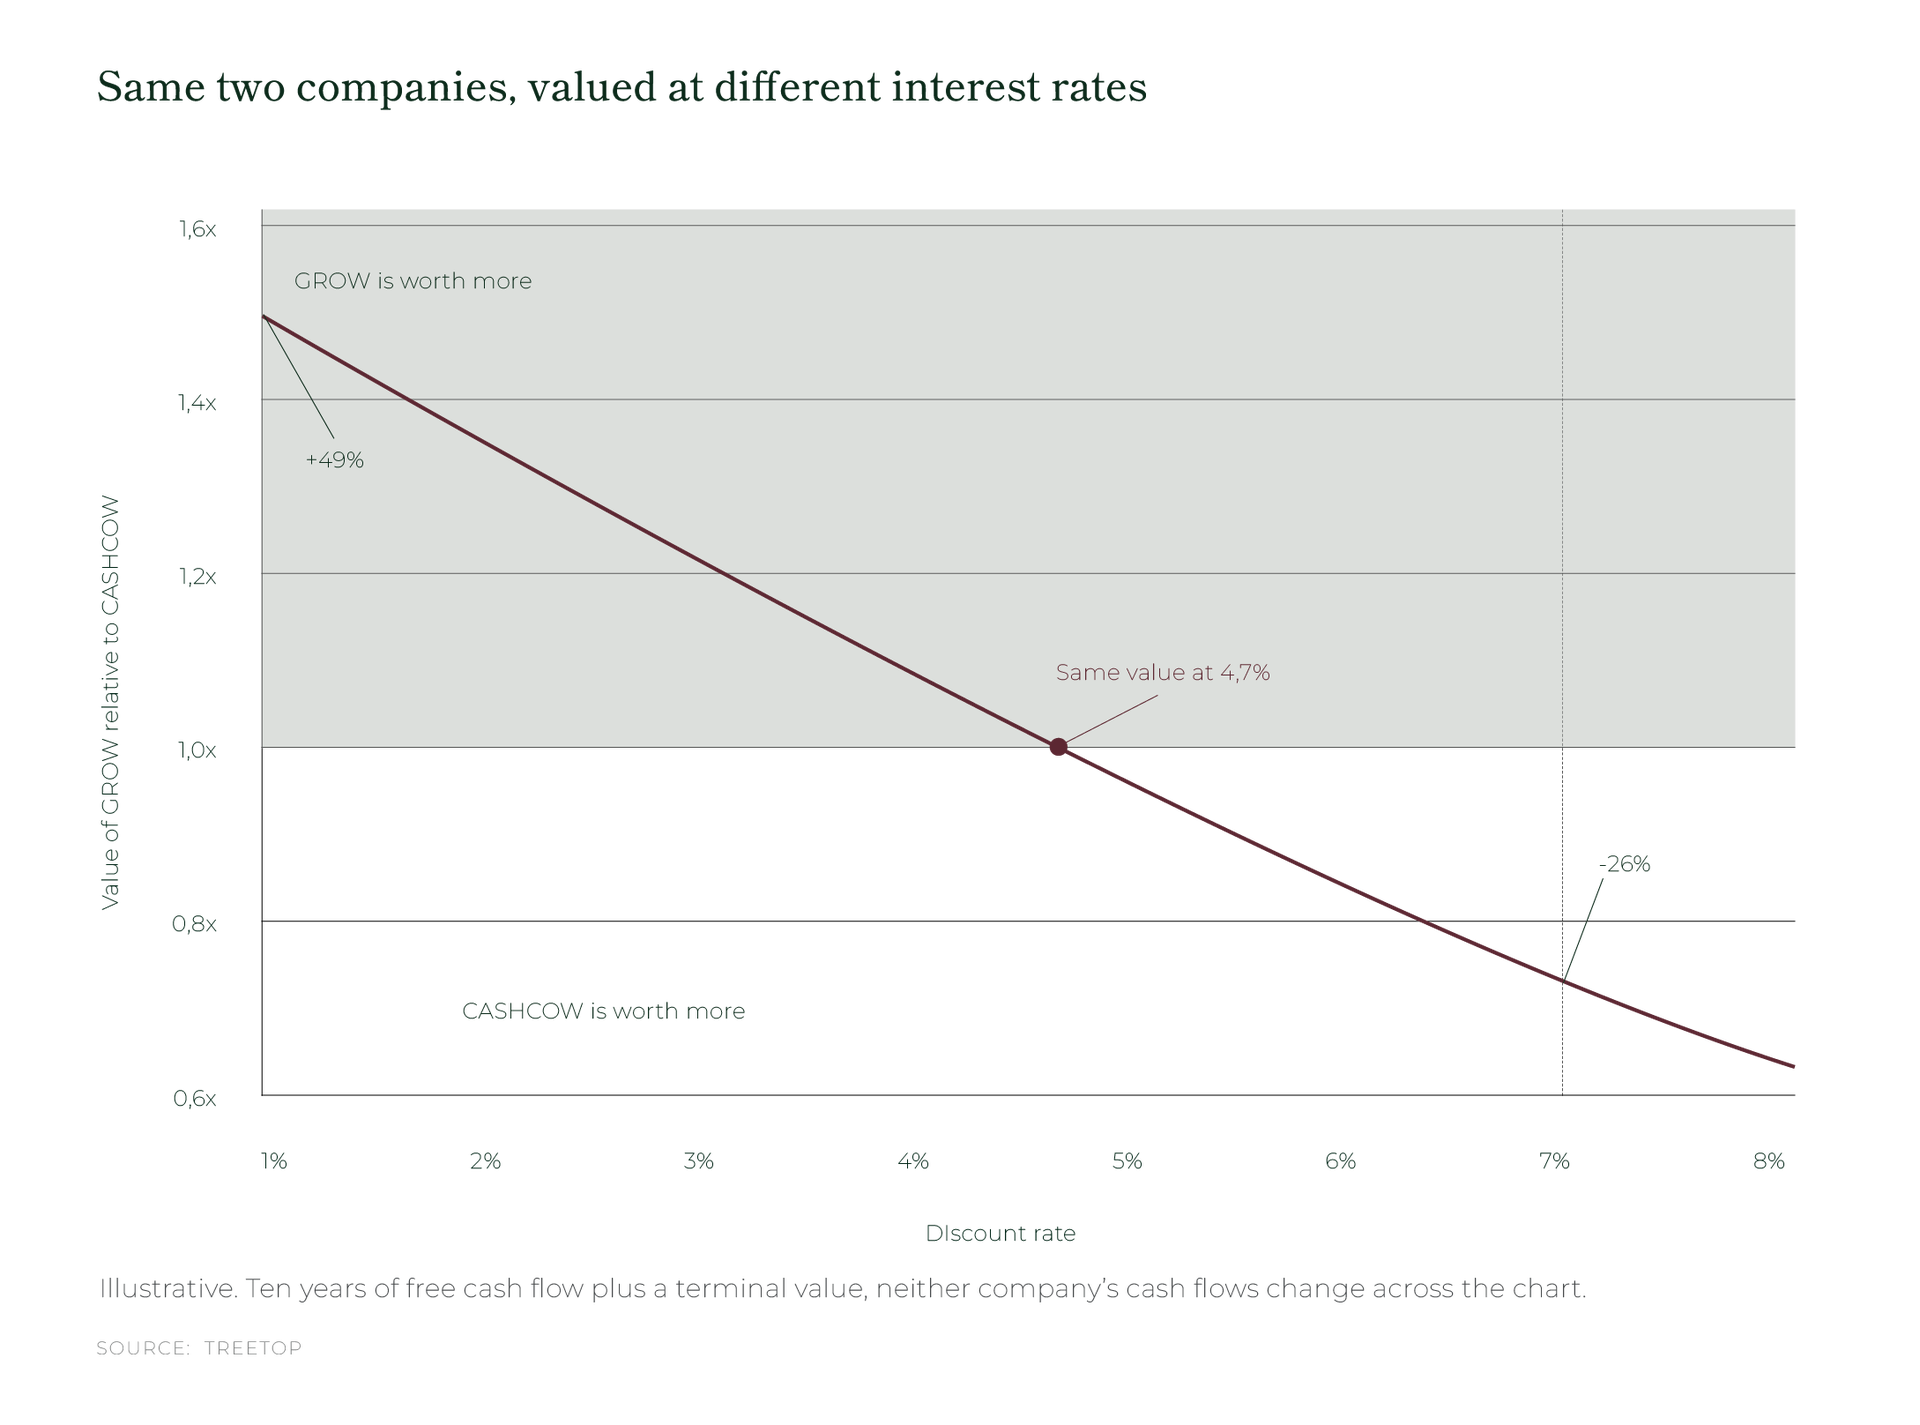
GROW is building something ambitious: it spends heavily for five years, so its free cash flow is deeply negative, turns positive in year six and settles at €165 million a year. CASHCOW is dull by comparison, earning a steady €100 million a year with no growth and no surprises. We value both the way any analyst would: ten years of cash flow, plus a terminal value that assumes each business continues at its year-ten level indefinitely.
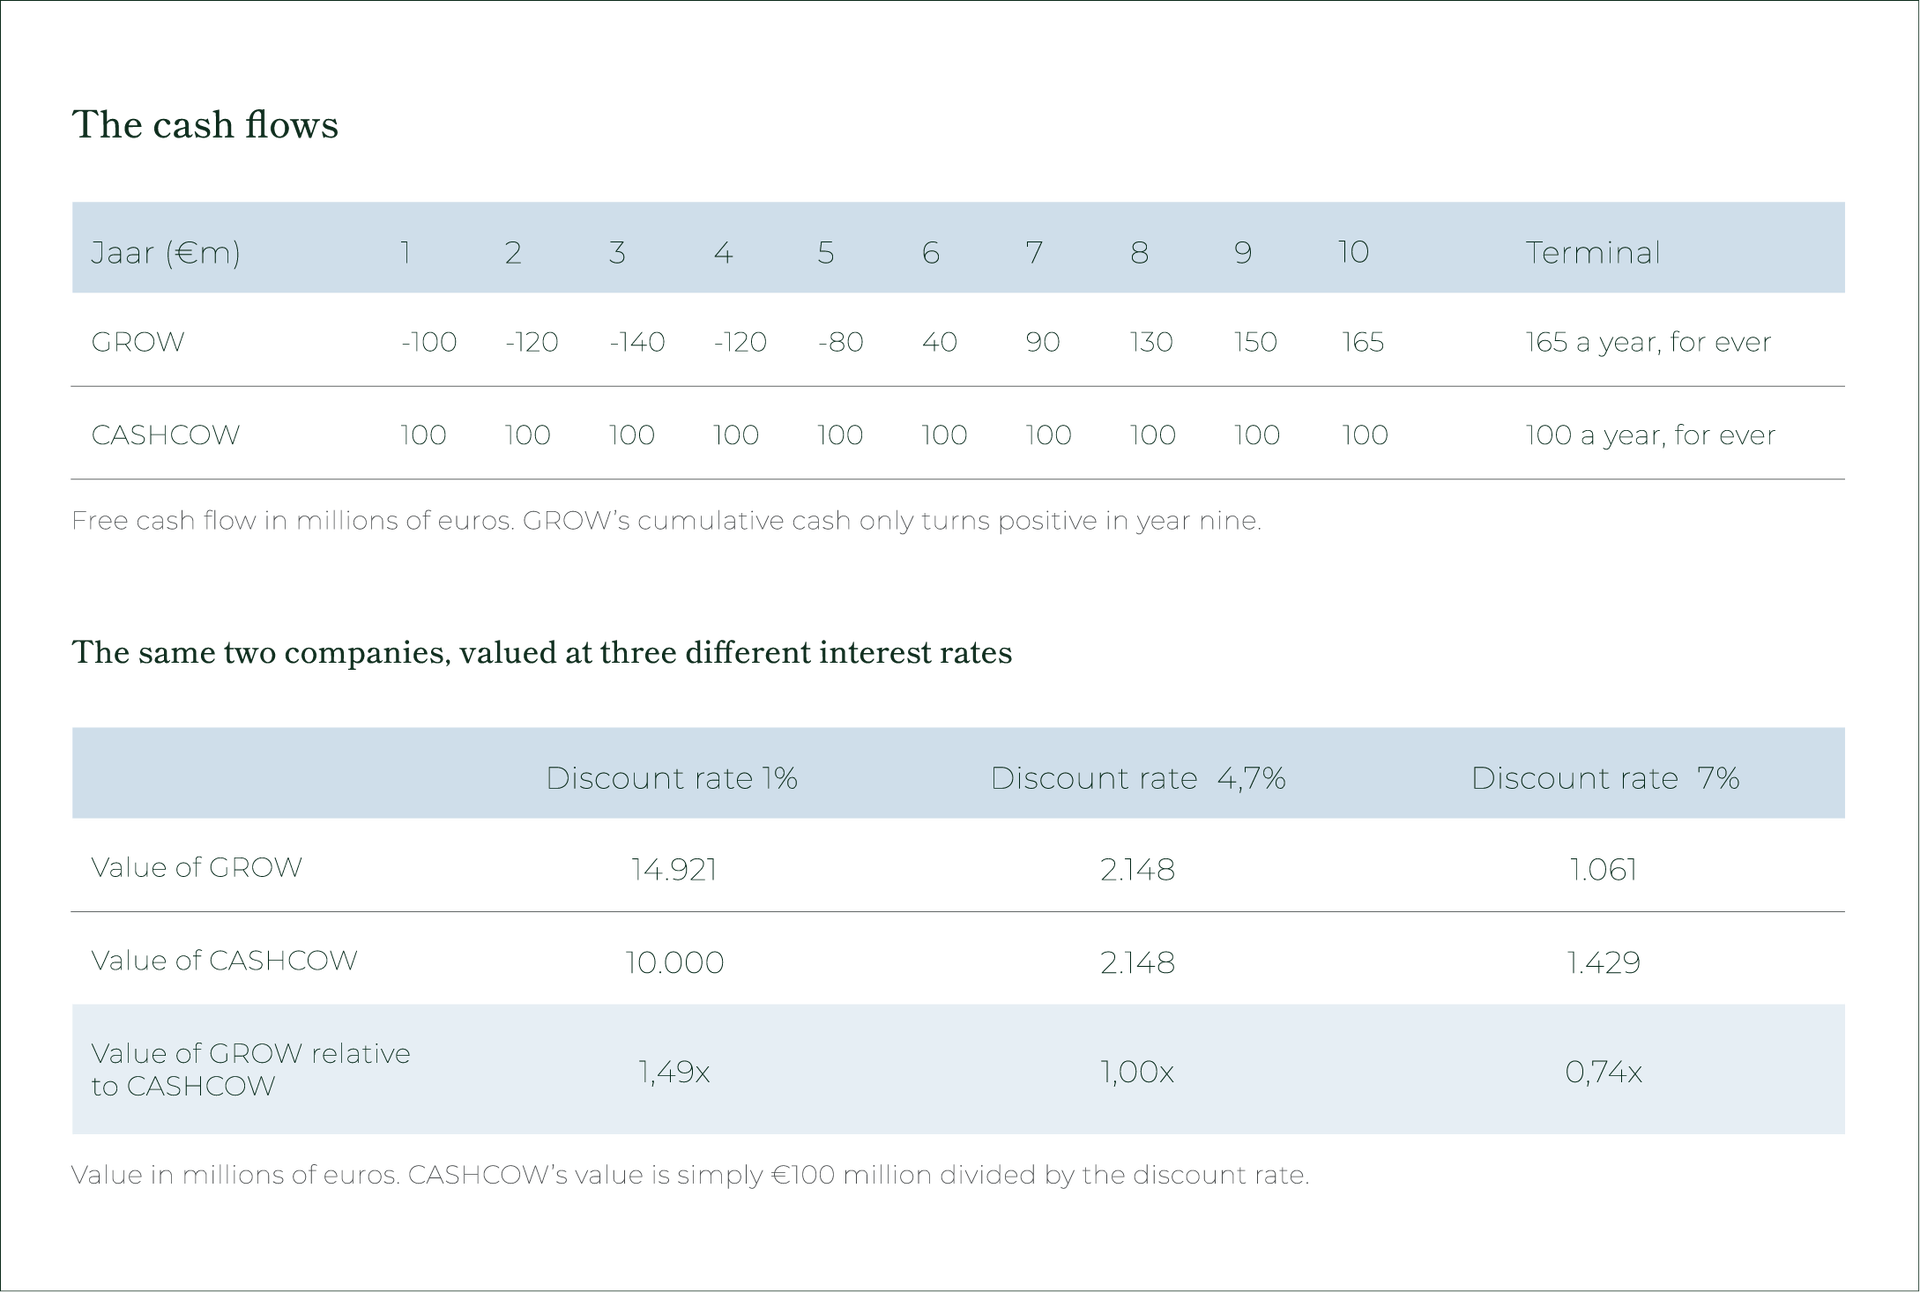
At a 1% discount rate GROW is worth ~50% more than CASHCOW. At 7% it is worth a quarter less. Nothing about either business has changed between those two points: not the products, not the management, not a single euro of cash flow. Only the price of time changed.
Same two companies, valued at different interest rates
At a 1% discount rate GROW is worth ~50% more than CASHCOW. At 7% it is worth a quarter less. Nothing about either business has changed between those two points: not the products, not the management, not a single euro of cash flow.
Only the price of time changed.
Same two companies, valued at different interest rates
SOURCE : TREETOP
Global Earnings: A Decade in One Picture
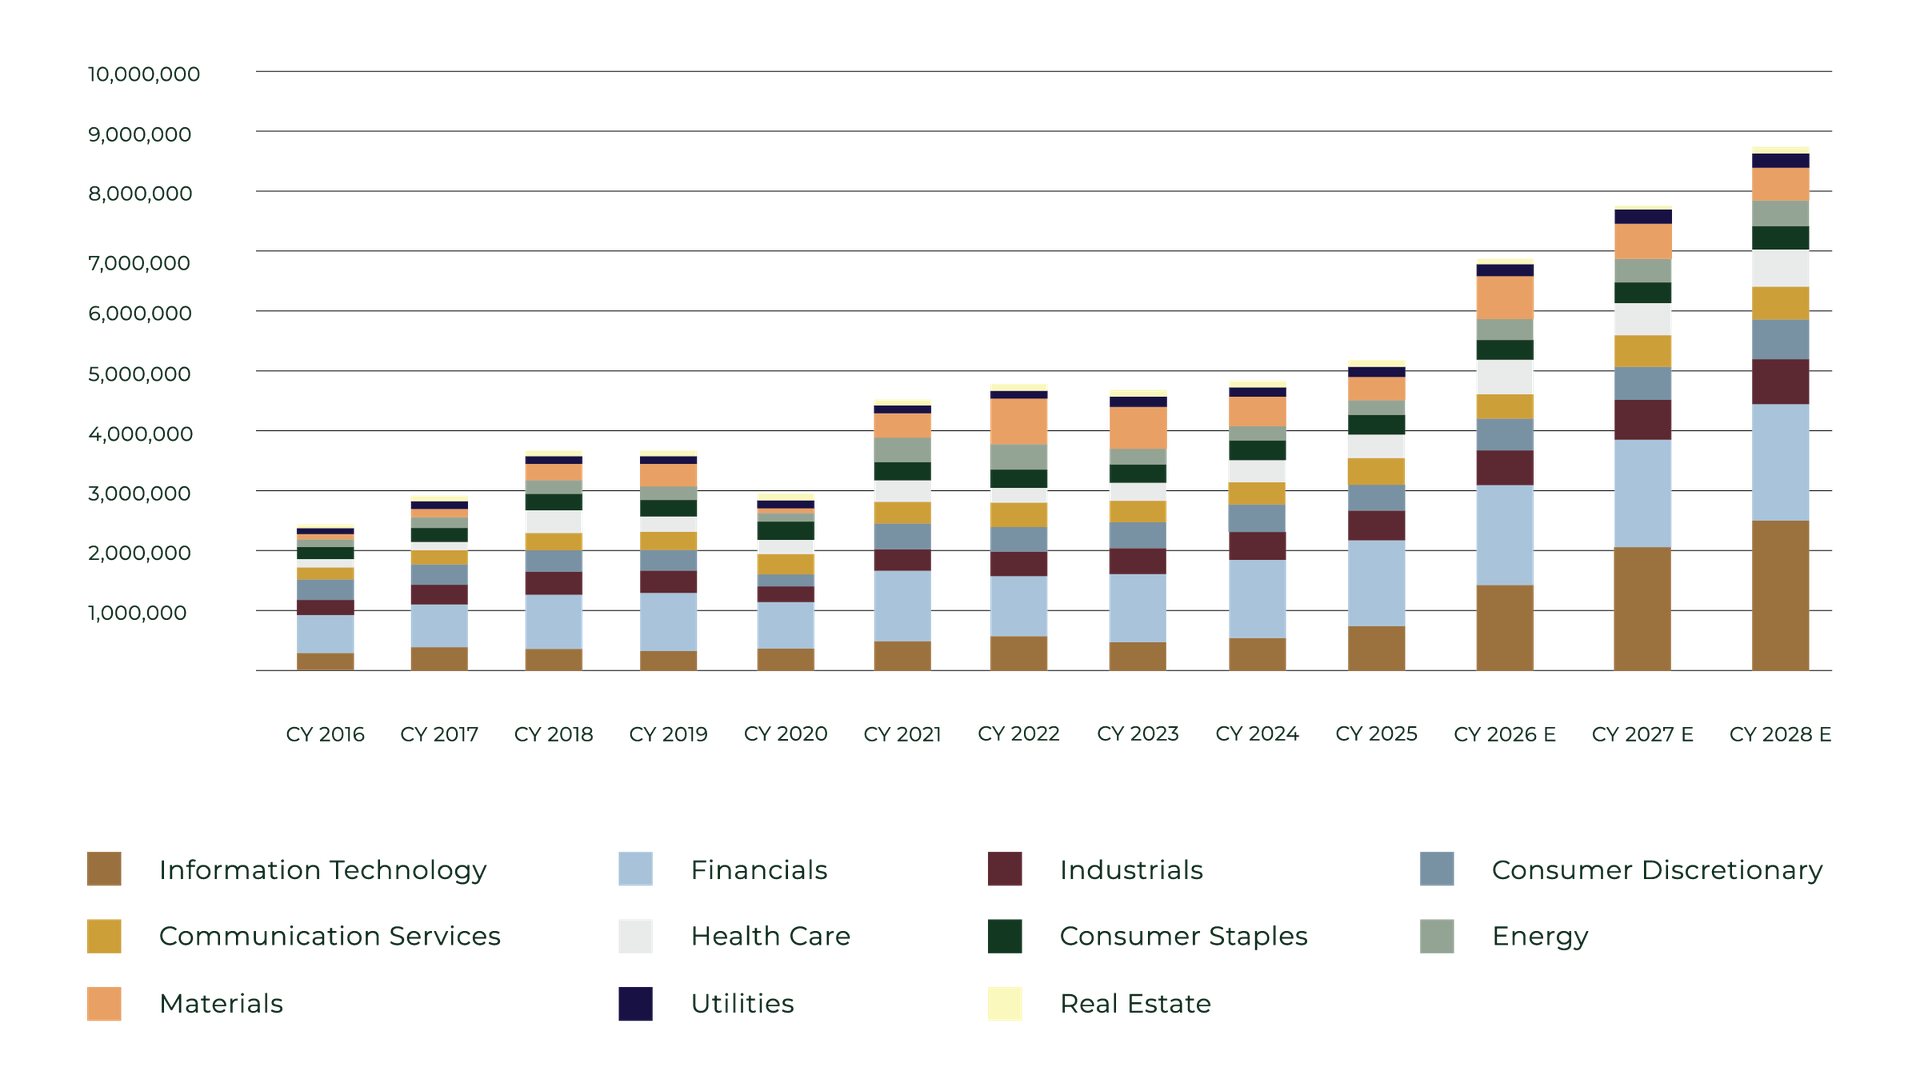
We have written often that share prices follow profits. It is worth stepping back from a single quarter to look at what the world’s listed companies have actually earned, and at what analysts now expect them to earn. The chart below breaks down the earnings of the MSCI ACWI by sector since 2016, with Bloomberg consensus estimates for 2026 to 2028.
Earnings from continuous operation (USDmn)-MSCI ACWI by sector
SOURCE : BLOOMBERG, TREETOP, MSCI
Four observations matter for a global investor.
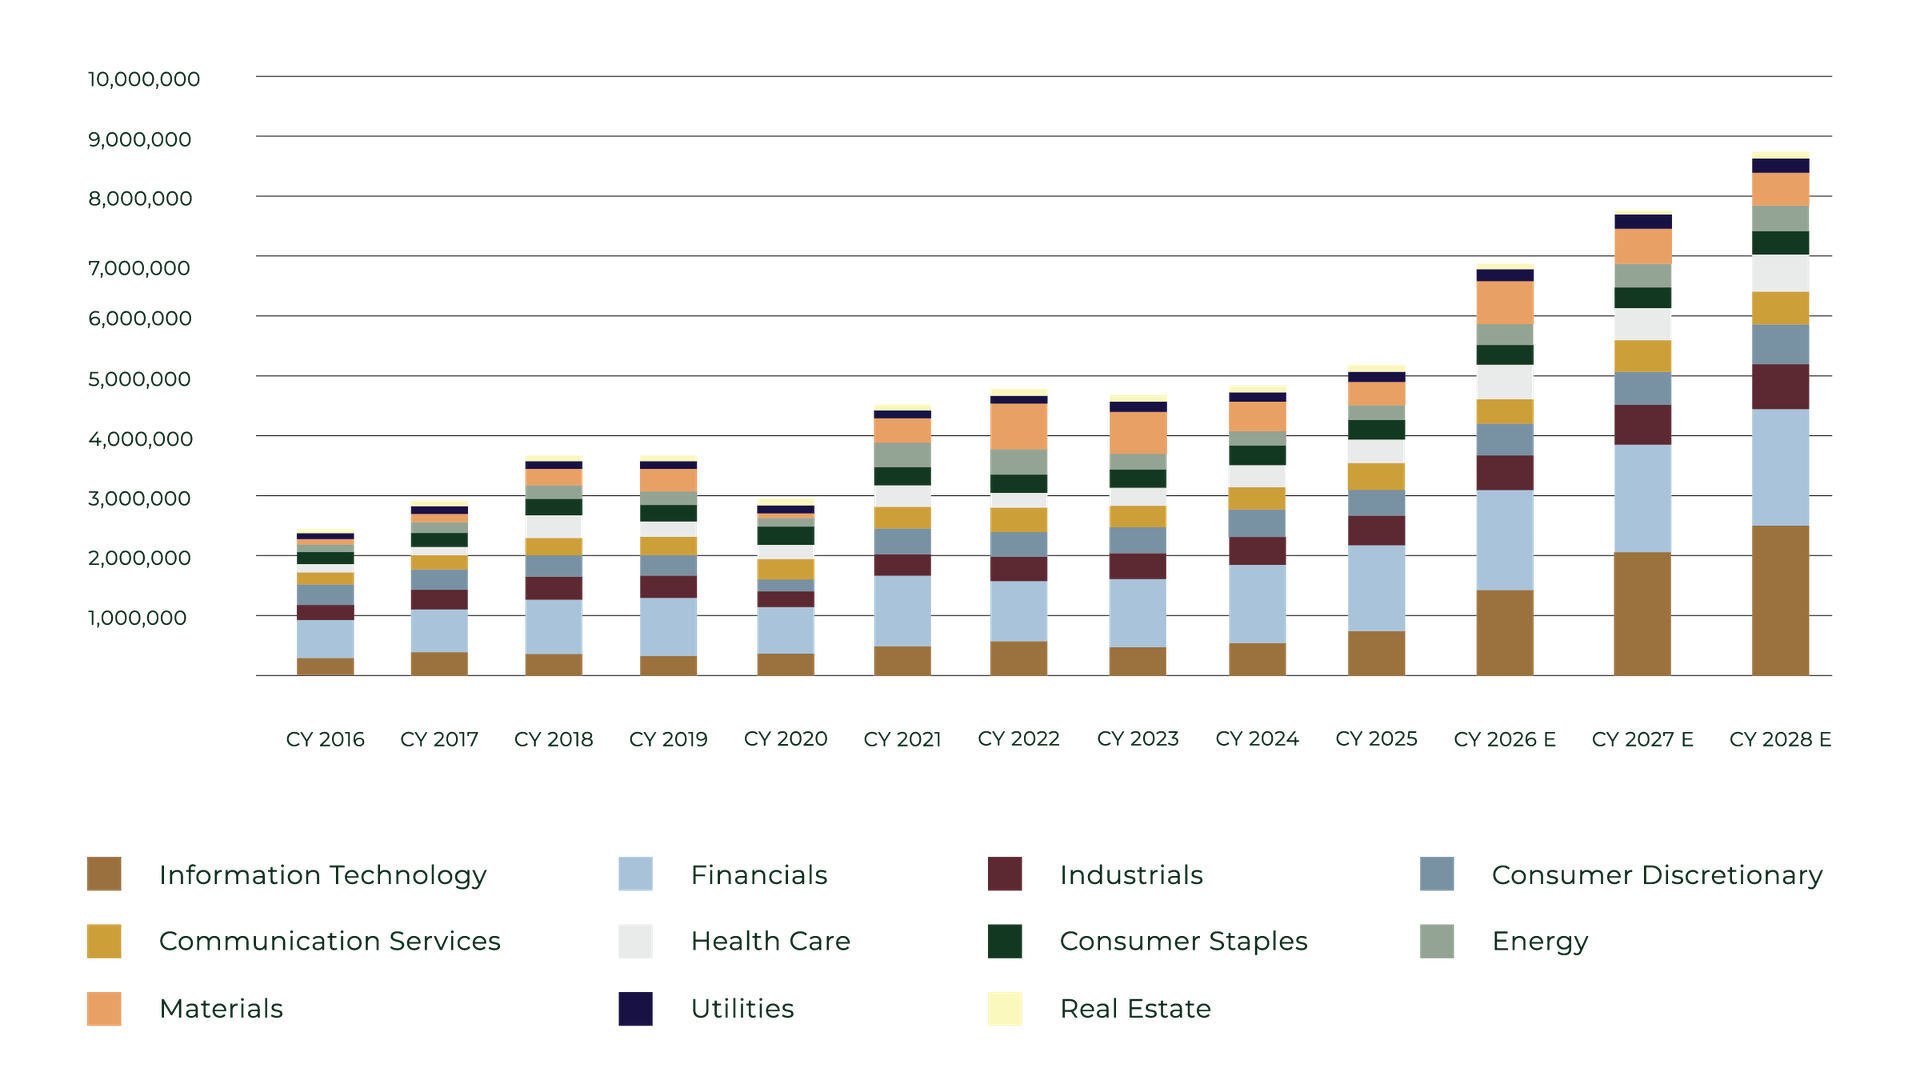
We have written often that share prices follow profits. It is worth stepping back from a single quarter to look at what the world’s listed companies have actually earned, and at what analysts now expect them to earn. The chart below breaks down the earnings of the MSCI ACWI by sector since 2016, with Bloomberg consensus estimates for 2026 to 2028.
Earnings from continuous operation (USDmn)-MSCI ACWI by sector
SOURCE : BLOOMBERG, TREETOP, MSCI
Four observations matter for a global investor.
Earnings roughly doubled in a decade.
Global profits grew from about USD 2.5 trillion in 2016 to USD 5.2 trillion in 2025, an average of 8.4% a year. That happened despite a global pandemic in 2020 and an energy and inflation shock in 2022. Few investors would have forecast such a decade in advance, and fewer still would have stayed invested throughout, had they tried to trade around each crisis.
Profits do not grow in a straight line.
Global profitability improved strongly between 2016 and 2018, fell sharply in the pandemic, then jumped to a new high in 2021 and stayed relatively flat for three years. A fresh acceleration began in 2025. The average of 8.4% a year is the arithmetic of a decade, not a promise about any single year, and an investor who needed profits to rise every year would have giv en up in 2020 or in 2023.
Technology and financials did much of the work.
The two sectors have consistently been the largest sources of global profits — between a third and 40% of the total through the past decade, and 43% in 2025, with financials at 28% and technology at 15%.
Technology and financials did much of the work.
The two sectors have consistently been the largest sources of global profits — between a third and 40% of the total through the past decade, and 43% in 2025, with financials at 28% and technology at 15%.
The consensus now expects a boom.
Bloomberg aggregate analyst estimates expect global profits to rise from USD 5.2 trillion in 2025 to close to USD 8.8 trillion in 2028, an increase of about 70% in three years. Technology accounts for the larger part of that increase, with its share of global earnings expected to double from around 15% to close to 30%, and, together with financials, to pass half of all the profits generated by listed companies worldwide.
WHAT THIS MEANS FOR THE WAY WE INVEST
The first two observations argue for staying invested and for patience when profits pause.
The third argues for real diversification: a portfolio built around a single source of earnings,
however impressive that source looks today, is a bet on one set of conditions persisting.
The fourth deserves more caution. Three-year earnings forecasts are built from the bottom up,
company by company, and they are optimistic far more often than they are pessimistic. The
expected boom may well arrive — the second-quarter results season was genuinely exceptional
— but accidents happen and it is safer to own a wide spread of businesses generating cash
today, across regions and across sectors, than concentrate in the part of the market where
future profit growth might or might not materialize.
Our Approach: Free Cash Flow Matters More Than Ever
« Revenue is vanity, profit is sanity, but cash is king. »
Business saying
WHY FREE CASH FLOW
Free cash flow is the cash a company generates after paying for its operations and its investments. It is the money that can be returned to shareholders through dividends and share buybacks, used to reduce debt, or for acquisitions.
When money was almost free, the difference between a company that generated cash and one that needed to borrow was less visible. Investors were willing to wait, and capital markets were always open. With yields at their highest levels in fifteen years in Europe and close to twenty years in parts of the US market, that is no longer the case. Free cash flow matters more today for three reasons:

◦ Independence. A company that funds itself does not need to refinance its debt at higher rates or raise capital when markets are unfavourable.
◦ A real comparison with bonds. When a government bond yields 4% or 5%, an investor should ask whether a stock offers a better return. The free-cash-flow yield (the free cash flow divided by the market value of the company) allows a direct comparison. A business with a free-cash-flow yield well above bond yields, and the ability to grow it, offers a margin of safety. A business with no free cash flow offers only a promise or hope.
◦ Returns to shareholders. Companies with strong free cash flow can keep paying dividends and buying back shares even when the economy slows. Share buybacks are one of the factors our strategies take into account.
Conclusion
WHY FREE CASH FLOW
Free cash flow is the cash a company generates after paying for its operations and its investments. It is the money that can be returned to shareholders through dividends and share buybacks, used to reduce debt, or for acquisitions.
When money was almost free, the difference between a company that generated cash and one that needed to borrow was less visible. Investors were willing to wait, and capital markets were always open. With yields at their highest levels in fifteen years in Europe and close to twenty years in parts of the US market, that is no longer the case. Free cash flow matters more today for three reasons:
◦ Independence. A company that funds itself does not need to refinance its debt at higher rates or raise capital when markets are unfavourable.
◦ A real comparison with bonds. When a government bond yields 4% or 5%, an investor should ask whether a stock offers a better return. The free-cash-flow yield (the free cash flow divided by the market value of the company) allows a direct comparison. A business with a free-cash-flow yield well above bond yields, and the ability to grow it, offers a margin of safety. A business with no free cash flow offers only a promise or hope.
◦ Le rendement pour l'actionnaire. Les entreprises aux flux de trésorerie solides peuvent continuer à verser des dividendes et à racheter leurs actions même quand l'économie ralentit. Les rachats d'actions font d'ailleurs partie des critères que nos stratégies prennent en compte.
Conclusion
We believe that the end of the era of free money is not a reason to leave the stock market.
Listed equities remain an asset class with great long-term return potential, and corporate
profitability is excellent. But higher interest rates are less forgiving on businesses that consume
cash, that depend on borrowing, or whose value rests entirely on a distant future. In this
environment, we believe the most reliable returns will come from companies that generate
real free cash flow today, bought at a fair price.
Please also remember that investing always involves risks and feel free to contact
our team who is available for any questions you might have about our services
and the risks involved when investing.
Jacques Berghmans & Félix Berghmans

Legal Disclaimer
The information contained in this document is for general purposes and does not take into account the investment objectives, financial situation or specific needs of
an investor. This document should not be given to a US investor (as defined in US regulations). This document is based on sources that TreeTop Asset Management
SA (the “Company”) believes to be reliable and reflects the views of the managers of the Company. This document is for information purposes only and does not
constitute investment advice or a product offering. The Company accepts no liability, directly or indirectly, for the use of the document information.
Data showing past performance and trends are not necessarily a guide to future performance or developments. Data & Information as of 30th September 2026.
TreeTop does not offer guarantee of result or performance.
Published by TreeTop Asset Management SA, a UCITS Management Company licensed pursuant to the provisions of Chapter 15 of the Luxembourg Law of 17th
December 2010.